http://wearcam.org/IEEE_SPICES_WaterHCI/WaterHCI_part1.pdf
(Note the magenta imprinting)
WaterHCI Part 1: Open Water Monitoring with Realtime Augmented Reality
Steve Mann, Faraz Sadrzadeh-Afsharazar, Samir Khaki, Zhao Lu, Christina Mann and Jaden Bhimani MannLab Canada, 330 Dundas Street West, Toronto, Ontario, M5T 1G5
Abstract—This is the first of our two accepted papers in this conference so we are presenting it as Part 1 in the new and growing field known as Water-HCI or WaterHCI (Water- Human-Computer Interface/Interaction/Intersection). WaterHCI originated in the 1960s and 1970s as a form of water in- teraction, water monitoring, water-based augmented reality / extended reality, and the like. Much of this work began with hydraulophones (underwater musical instruments) in the 1960s and underwater Augmented Reality (AR) or eXtended Reality (XR) with the SWIM (Sequential Wave Imprinting Machine) in the 1970s. SWIM is a sensing and meta-sensing (sensing-of- sensing) tool with real-world applications in the XR visualization of otherwise invisible phenomena. In this paper, SWIM is applied to understanding open water, such as at beaches, to realtime understanding of water characteristics, and their spatial variations. A sensor and meta-sensor pod was developed and can be towed behind a swimmer to provide immediate XR feedback of the current water characteristics to enable the swimmer to choose an optimal path to swim. Part 2 of WaterHCI was also developed based on autonomous crafts, drones, and the like to sense water quality and generate an XR “heatmap” that shows spatial variations of water properties such as water temperature, turbidity, conductivity, etc., made visible to a swimmer’s head-up display in realtime.
Index Terms—SWIM (Sequential Wave Imprinting Machine), Augmented Reality (AR), eXtended Reality (XR), Sensing, Meta- sensing, Open water, Water reservoir, Robotics, Autonomous sensing, Digital Signal Processing (DSP)
I. INTRODUCTION: WATERHCI AND SWIM
In this paper, SWIM (Sequential Wave Imprinting Machine) is combined with concepts that will lead us toward a new approach to citizen science and outdoors education, etc., to develop an innovative beach water quality sensing tool, and to build on the concept of a “TeachBeachTM ” [1], [2] that will be further developed in Part 2 of this 2-part paper series.
SWIM arises from early experiments in WaterHCI, which itself has grown as a new field of research [2]. See Fig 1.
A. SWIM (Sequential Wave Imprinting Machine)
The SWIM (Sequential Wave Imprinting Machine) is an augmented reality / extended reality (XR) system, invented in 1974, which allows users to see, understand, and photograph otherwise invisible phenomena [4]–[7], and has been explored in the context of X-band (10 GHz) marine radar [3], [5], e.g. chirplet-based sensing of “growlers” (iceberg fragments).
A note on terminology:
- Ice floe: 20m to 10km across;
- Iceberg: > 15m long;
- Growler < 1m high, <5m long.
Fig. 1: Our TeachBeachTM that we developed at Ontario Place as an outdoor classroom to explore the new field of WaterHCI. Here we are teaching the Headflow Taxonomy for water-human-machine-interaction. Growlerboarding is a new sport that grew out of research on WaterHCI. Participants stand on small ice fragments while paddling in icewater, along with controlled cold- water exposure exercise and health benefits while the movement of the growler is monitored by marine radar [3].
978-1-6654-4940-3/22/$31.00 © 2022 IEEE
-3dB -3dB
Kustom TR-6 Doppler radar
SWIM Waveform
Direction of Motion …
Sand as Acoustic Damper
Water-H.C.I.
SWIM SWIM
Tx/Rx
Water Trough
Wand
Computer
Vessel
Fig. 2: SWIM was discovered when an RCA TMV-122 cathode-ray oscil- lograph that had no working timebase (pictured upper leftmost) was moved back-and-forth while connected to the output of a Doppler radar set. Here an Eico 460 oscilloscope (which has a larger and brighter screen than the RCA) is moved in a similar way to show the phenomenon. In some experiments the oscilloscope was moved on rollers, and in others it was upon a vessel moving in a water trough to attain smooth movement. In some experiments the oscilloscope was replaced with a linear array of light sources and a set of comparators forming a one-dimensional digital display that was moved back and forth in front of an X-band police radar or marine radar set. This provided an augmented reality overlay requiring no special eyeglasses to see, since the waveform overlay can be seen directly by the naked human eye, and it can also be photographed as in the photograph shown.
S.W.I.M. 1974
Water
Trough
Sand as Acoustic Damper
Water-H.C.I.
Rx Hydrophone
SWIM Waveform
Direction of Motion
There are 21 cycles of this sound wave over its
1.5 metre distance of travel.
Each cycle is 150cm/21 = 7cm long.
Row of green lights moves with speaker and displays output of lock-in amplifier from microphone.
Measured speed of sound
= 0.07 metres/cycle * 5000 cycles/second
= 350 m/s. (True value at 27deg. C is 347m/sec)
Tx Hydrophone
Sig.
Δφ Lock-in θ Amp R
…
Fig. 3: Here a stationary transmitter creates soundwaves that are explored upon a moving vessel. A receiver on the moving vessel drives a one-dimensional display that is waved back-and-forth to make the waveform visible. The display is co-located with the receiver so that it shows a true and accurate waveform of what is present at the receiver. A lock-in amplifier is used instead of the homodyne receiver principle of the Doppler radar.
Two early embodiments of this invention are shown in Fig 2 and Fig 3. Fig 2 depicts an early discovery of the SWIM concept. A one-dimensional display moved in front of a Doppler radar, in which the display is connected to the baseband Doppler output, causes a Doppler shift proportional to movement velocity, and thus self-displays the waveform, though compressed to 1/2 space-scale, e.g. with approximately 5cm wavelength (instead of 10cm). Fig 3 shows a slight variation in which the transmitter and receiver are separate, and one moves with the vessel while the other remains stationary. This configuration corrects for the error of 1/2 in the spatialization. Here we can see underwater soundwaves.
A modern version of SWIM as a tool for education and teaching is shown in Fig. 4.
SWIM senses a variety of physical phenomena, and it is also used to sense sensing itself (i.e. for meta-sensing). Just as a meta-conversation is a conversation about conversations, and meta-data is data about data, meta-sensing is the sensing of sensors and the sensing of their capacity to sense [8]. Fig. 4 depicts the sensing of sensing (e.g. sensing a microphone’s capacity to sense, and sensing a motion sensor’s capacity to sense). In addition, SWIM can also be used to depict various otherwise invisible phenomena, such as the interference pat- tern between two microphones in air, or hydrophones under- water, as seen in 5. Recordings of data (metaveillogrammetry) and photographs (metaveillogrammetry) of sound wave prop- agation can be used to infer water qualities and charateristics. In this way SWIM is a WaterHCI medium of artistic and scientific discovery and exploration for playing in and with water and exploring its properties through TinquiryTM, which is “tinkering” as a form of inquiry (e.g. learning through unstructured aquatic play).
B. Mersive Reality (“Mersivity”)
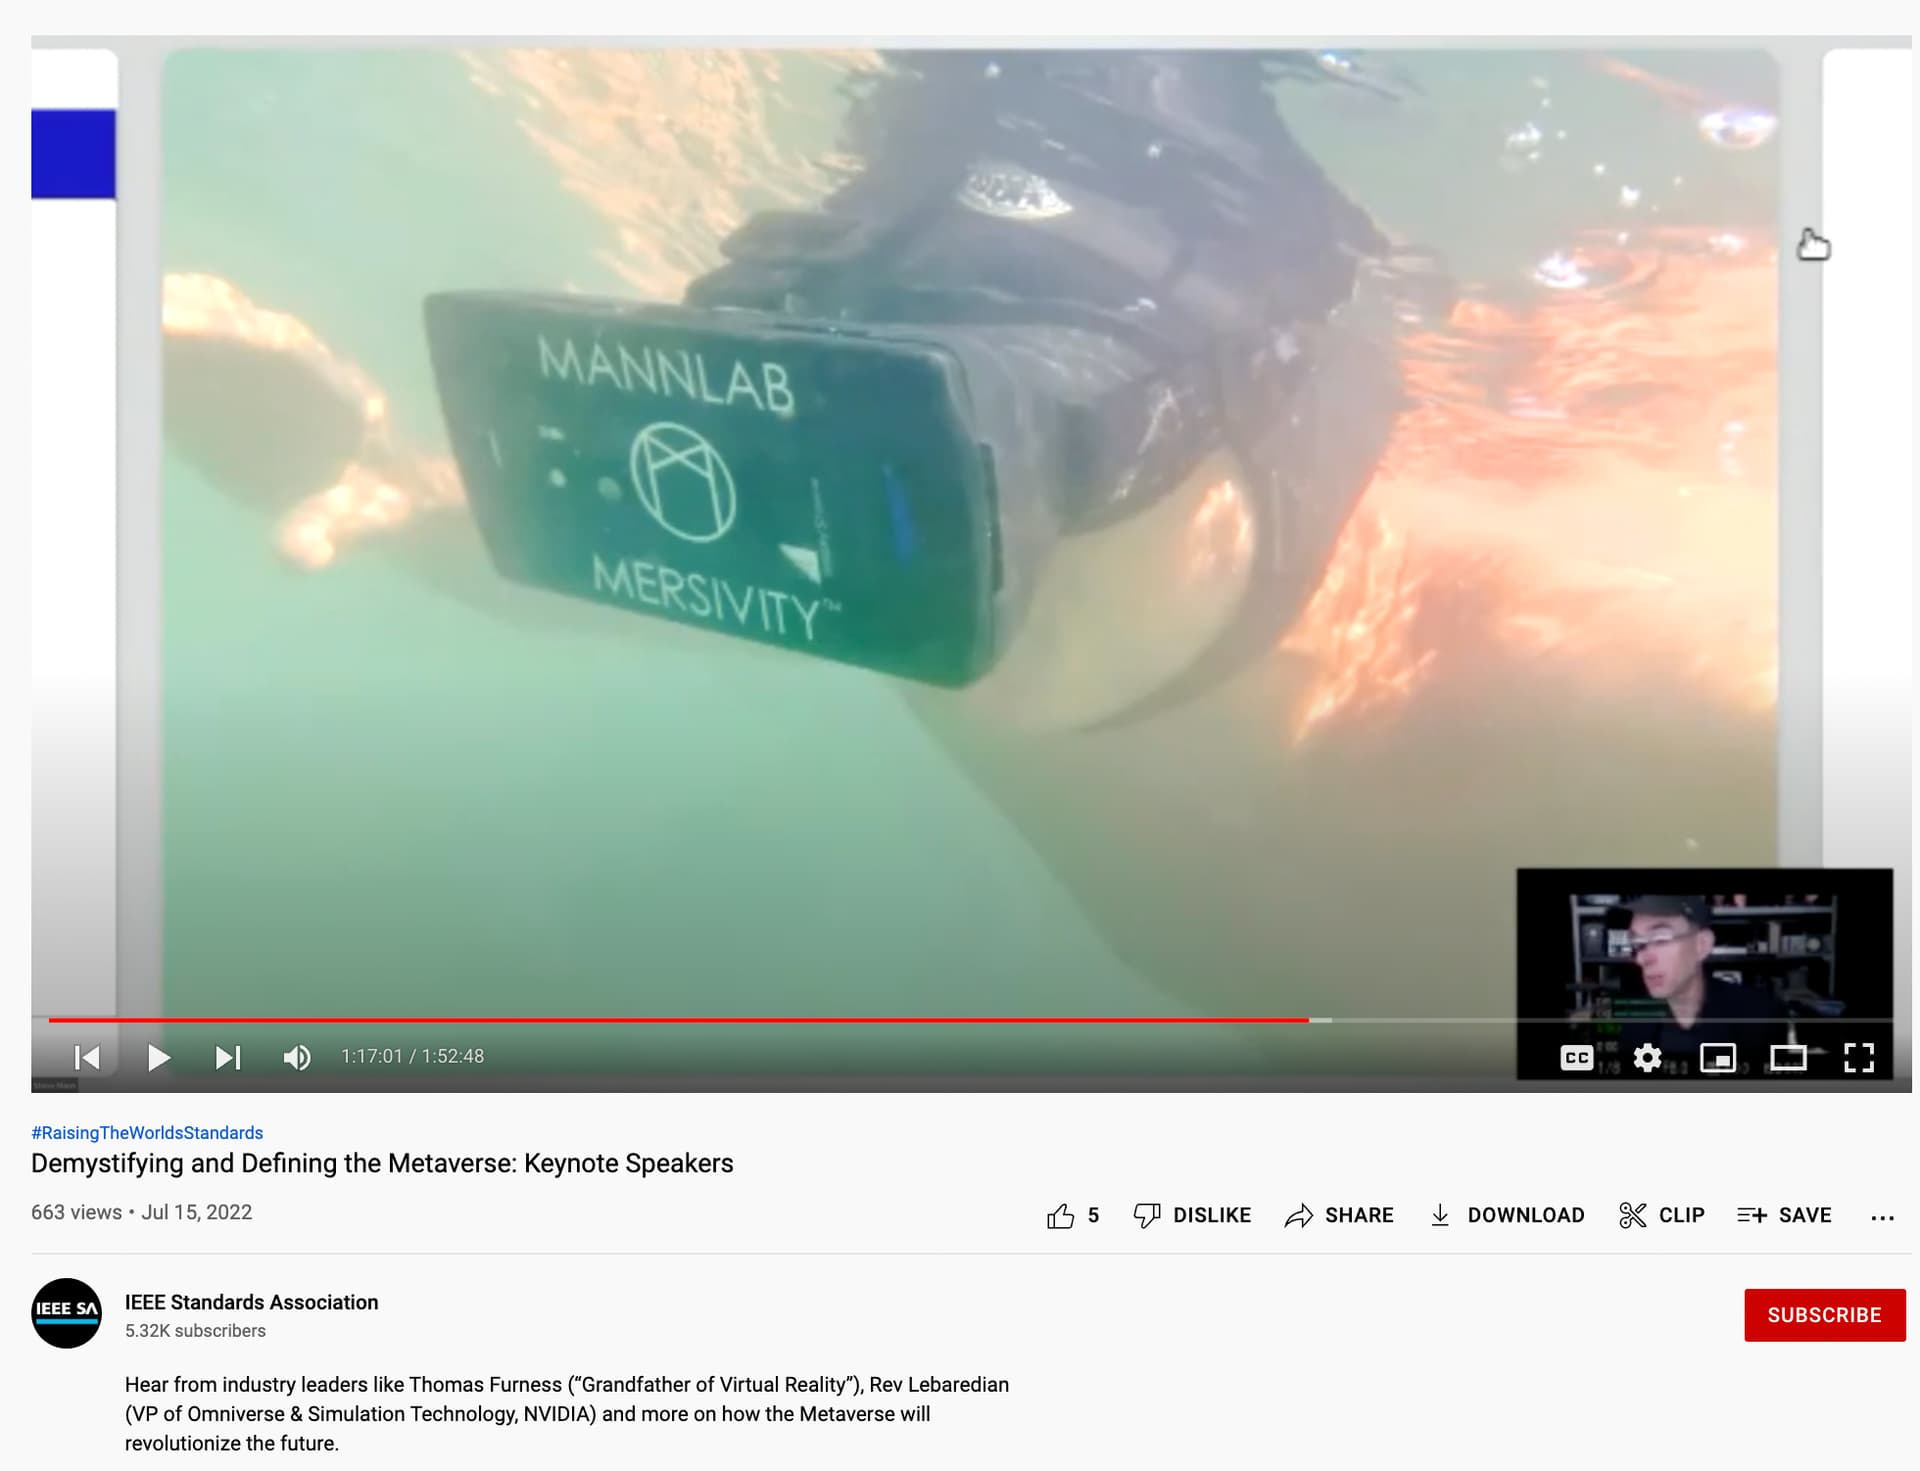
Virtual, Augmented, and eXtended Reality (VR, AR, and XR) can virtualize, augment, and extend human sensory capabilities. The MannLab Mersivity underwater VR/AR/XR headset is used (See Fig. 6) to visualize spatially-varying beach water characteristics such as temperature, conductivity,
Fig. 4: SWIM (Sequential Wave Imprinting Machine) is an array of LEDs connected to a lock-in amplifier allowing us to see and understand a variety of physical phenomena, and is useful in STEM education. (Top) Seeing and photographing the capacity of a microphone to sense sound waves. (Bottom) Seeing and photographing electromagnetic radio waves (electric field in green LEDs and magnetic field in magenta) from a microwave motion sensor [7].
turbidity, etc., as “heat maps” overlayed onto the water while we swim. The practical benefit of augmented reality is that it can assist swimmers in picking the most swimmable paths or patches of open water.
II. GOALS AND OBJECTIVES
Existing water quality sensor systems use proprietary tech- nology which decreases interoperability and limits access to data, especially by citizen scientists and others operating in a GNU Linux open-source “home built” environment. With waterHCI technologies we empower the citizen scientists with technology able to conduct water quality measures. This in- terface between water and humans allows us to extend the ca- pabilities of human sensing with a device that measures water quality indicators, including pH, dissolved oxygen, turbidity, temperature, conductivity, nitrates, phosphorus, optical clarity, and solid particulates. This waterHCI technology allows the
Function Gen.
SWIM Wand
SWIM Computer
Vessel
This moving speaker emits a 5000 CPS (Cycles Per Second) tone, which this microphone hears.
Lock-in amplifiers.
Ref.
S.W.I.M. 1974, SONAR
Fig. 5: WaterHCI SWIMbot in air and water… Top left: Photographs of the interference pattern between the capacity to sense of two Shure SM58 microphones. SWIMbotTM apparatus including Lock-in amplifier can also be seen, reproduced from [7]. Top right, hydrophones instead of microphones, within an eXtended Reality (XR) WaterHCI environment (40kHz). Bottom row: sensing and understanding water quality by photographing the interference patterns of sound wave propagation in the water (metaveillography), and also by metaveillogrammetry. Left: 40kHz. Right: 100kHz.
Fig. 6: The MannLab Mersivity VR/AR/XR headset, pictured here at one of the three beaches under test, was used for realtime visualization of spatially- varying beach water characteristics, “heatmap” overlays, etc., while swimming in the water.
user to experience real-time AR graphs and virtual maps as they interact with their environment. We summarize the contributions as:
- continuous data collection allows for a real-time under- standing of environmental status;
- the spatial resolution of a moving sensor yields far more data points than manual collection at just 1 or 2 (or a small number of) points;
- the open-source nature allows for interoperability with other smart systems and enables further development by third parties;
- open-access allows more people and organizations to benefit from the data and develop new methods of pro- cessing/understanding water quality monitoring data;We hope that the proposed system will enable the citizen scientists and broader public to engage with waterHCI tech- nologies and participate in the social activity of water quality measurements.III. EXPERIMENTAL SETUPTo ensure efficacy of the experiment, two setups were de- veloped, one powered by an individual swimmer, and the other by way of a “smart SUP” (smart Stand Up Paddleboard). The first setup features a swimmer towing a SWIM-based sensor pod in a free-form pattern enabling real-time visualization of heat map data across the aquatic environment - See Fig. 7.For the second setup, the SUP is used - See Fig. 10.IV. EXPERIMENTAL PROCEDUREWe devised a prototype that includes a temperature sensor that is connected to the Analog-to-Digital Converter pin on an Arduino nano. A SWIM, as outlined in [9], is also connected to the Arduino nano to be used as a visualization tool, where the temperature of the water being measured shall be used to determine which LED of the 32 LEDs along the SWIM will light up, with the top LED denoting a water temperature of 25.3°C and the bottom LED denoting a temperature of 24.8 °C (i.e. scaled to the range of surface water temperatures present in the lake where the participants are swimming).A Fluke 28II underwater multi-meter with a thermocouple probe was used as a reference to calibrate the results of the temperature sensor in the sensor pod apparatus. For example, the pod gives a measurement of 25.3 °C with the multi-meter
giving a reading of 25.7°C. The results indicate a 1.556% error margin, which we considered to be acceptable for a system used for teaching purposes.
The prototype sensor pod was towed by either a human swimmer or a SUP across the test area. While conducting the experiment, a long exposure photograph is taken of the appa- ratus moving across the water. Hence, a light trail indicating the correlation between the spatial coordinates and the water temperature is recorded on the photograph, as is typical with SWIM [8].
When light levels permitted (i.e. when it was dark enough) long-exposure photographs were taken and saved, to create additional data overlays.
V. TESTING
The modular nature of the proposed system allowed the sen- sor pod to function either as something towed by a swimmer (Fig. 9), or by a SUP.
A. Sensor pod towed by swimmer
As demonstrated by Fig. 9, a rope was used to tow the sensor pod behind a swimmer. The distance between the apparatus and the swimmer were pre-determied as 1.5m so the apparatus would not drift sideways and flip over due to the effect of the waves (when the distance was too short), and still provide data close to the swimmer (e.g. while the swimmer is wearing the Mersivity VR/AR/XR), more relevant data is displayed). Wearable sensors may also be used when we wish to exactly co-locate the data to the swimmer, but phenomena like water temperature are then affected more strongly by the swimmer.
This approach was adopted for us to test one of the potential use cases of the apparatus and also served the purpose for us to test for multiple times without the fear of running out of battery power compared to the autonomous watercraft approach. However, even the most experienced swimmer, albeit with ability to out-last an autonomous watercraft across multiple tests, cannot sustain a relatively constant speed across a single test since the swimmer will slow down due to the drain of stamina - this is something we address in Part 2 of WaterHCI.
B. Sensor pod towed by SUP
A SUP was considered as a second option to the swimmer- towed sensor pod. The modular design of the sensor pod allowed us to attach it to the paddleboard for furhter testing and experiementation. By joining these two technologies, we presented the smart SUP. Further, we redeveloped the output mechanism for the sensor pod as to display the data via a SWIM stick attached to the read. The SWIM stick featured a 1x144 NeoPixel RGB LED strip attached to a wooden stick mounted on the SUP behind the paddler(individual operating the SUP). An Arduino uno was mounted to the top of the stick as a portable micro-controller allowing us to control both data printed graphically and the initial display text to indicate the quantity being sensed. An algorithm was developed to
Phenomenological Representation of Temperature
2 4 . 8 oC
Sequential Wave Imprinting Machine (SWIM)
Direction of Motion
μ
Fig. 7: Sensor pod and sequential wave imprinting machine being towed by swimmer. A realtime heatmap is generated and continuously updated while the swimmer pulls the pod through the water, while its position is tracked by a drone hovering overhead. Realtime “heatmaps” are available for viewing.
o 25.3 C
Sensor Pod
Swimmer
Fig. 8: Demonsration of SWIM stick on SUP where text indicates the E- Coli levels of the beach, obtained from the official city of Toronto website. Following the text, a fixed-frequency sine wave indicated the speed of the SUP. As can be seen in the photo, the SUP moves slower as it travels from left to right, as shown with an apparent increase in frequency in the long exposure photo.
print characters via changing the colour of the LED array. We selected the 5x8 ECE835 font as a point of reference, as each font pixel was equal to 17 pixels length-wise and 1-pixel width-wise which fell within the range of the number SWIM stick LED’s. As seen in 8 where said algorithm is used to display the E-Coli levels of the beach water, followed by a constant-frequency sine wave used to display the speed of the SUP.
The ardunio UNO also had two analog input signals con- nected to two potentiometers that could be controlled by the user for adjusting speed and brightness. The developed printing algorithm adjusted the iteration speed of printing, proportionally for each pixel column in the character as to not distort the phrase and or data quality being printed. Likewise the brightness values were scaled to prevent clipping. Since the circuit was an input to the microcontroller, it allowed on the fly edits without having to restart the program each time - beneficial for collecting continuous sets of data when on the water.
One experiment to monitor water quality was performed using this setup in various bodies of water. A Wavetek model 185 signal generator was connected to a speaker which gener-
Fig. 9: Sensory and meta-sensory payload being towed by swimmer. As seen in the photo, the pod is towed at a fixed distance from the swimmer’s rear allowing it to collect data from the path of the swimmer as they interact with their aquatic environment.
ated a fixed-frequency sine wave and was placed underwater. A SYSUxMannLab Model 1024SO lock-in amplifier was then connected to a microphone attached to the paddle used to operate the SUP, whose signal was fed into the lock- in amplifier and broken down into its real and imaginary components. The amplitude of the resulting signal was fed into another analog input of the Arduino microcontroller which normalized its values between 0 and 142. After printing the display text(”WATER QUALITY”), the signal output from the lock-in amplifier displayed as a multi-pixels point as to prevent aliasing. We applied an exponential dropoff on the point illumination from the SWIM stick as to enhance precision of it’s position when viewed from the camera. As the paddler moved over the water, they expand a 1D slice of data into a spatial mapping of the signal over the water. The height of the dot was indicative of the signal strength while it’s horizontal positioning in the image is simply a spatial mapping of the swimmer’s sensor data over time. See fig 10, where we show
Fig. 10: Sensing and metasensing by way of paddleboard with SWIM (Sequen- tial Wave Imprinting Machine) moving with the sensors and metasensors. In the former image, one can see signal strength slowly increasing and decreasing as the SUP approaches then gets farther away from the source over time. In the latter, one can notice the general chaos and incoherence of the signal strength even as the SUP passes the audio source, indicating much less clear transmission.
experimental results.
VI. RESULTS AND DISCUSSION
We created a VR/AR/XR system to help understand and teach principles of environmentalism with regards specifically to understanding of beach water, and the spatial variation of beach water characteristics. This is an important first step towards developing a system to understand, teach, and care for our beaches, and to create an outreach program to educate the public about the importance of beach water quality.
VII. CONCLUSION
A sensor/meta-sensor pod was developed for being either towed by a swimmer, or by a paddleboard. This provided realtime water sensing and meta-sensing so as to help guide a swimmer, as well as to help in the understanding of the beach. Graphical renderings were produced in realtime, and when conditions permitted (e.g. in subdued lighting) long-exposure photographs were also made using a SWIM (Sequential Wave Imprinting Machine).
This resulted in an epistemological understanding of the beach water, and its various properties and qualities.
VIII. FUTURE WORK
Future work will involve the creation of a sensory and meta- sensory beach environment system that helps conservation authorities and others teach the natural beauty of coastal areas, and deepen our understanding of our environment.
Additional sensors will be used on the sensor pods to conduct real-time analysis of the water quality based on the measurements to provide real-time feedback to the user where the system shall guide the user through VR/AR/XR towards areas with safe swim characteristics to provide better health.
IX. ACKNOWLEDGMENTS
We would like to thank Cayden Pierce for help in writing up some of the motivations, goals, objectives, etc., and Liam Cassano for help with the boat design. We also thank Kyle for help with the underwater SWIMbot (underwater robotic SWIM) and many other aspects of the research. Thanks also to AMD for donation of the WaterHCI server (waterhci.com) and Vuzix for donation of the SmartSwims, and to the McLuhan Program and our Priveillance Working Group (priveillance.com), as well as the 794 members of SwimOP.com for help in creating the TeachBeachTM and SwimOP = Swim at Ontario Place community.
REFERENCES
[1] S. Mann and M. Hrelja, “Praxistemology: Early childhood education, engineering education in a university, and universal concepts for people of all ages and abilities,” in 2013 IEEE International Symposium on Tech- nology and Society (ISTAS): Social Implications of Wearable Computing and Augmediated Reality in Everyday Life. IEEE, 2013, pp. 86–97.
[2] S. Mann, M. Mattson, S. Hulford, M. Fox, K. Mako, R. Janzen, M. Burhanpurkar, S. Browne, C. Travers, R. Thurmond, S. min Park, A. Roufas, C. Pierce, S. Khaki, D. Lam, F. Sadrzadeh-Afsharazar, K. Simmons, T. Yonezawa, and A. Manzoor, “Water-Human-Computer- Interface (WaterHCI): Crossing the borders of computation, clothes, skin, and surface,” in Proceedings of the 23rd annual Water- Human-Computer Interface Deconference, Ontario Place TeachBeach, Toronto, Ontario, Canada, 12 2021, pp. 6–35. [Online]. Available: Water-Human-Computer-Interface (WaterHCI): Crossing the Borders of Computation, Clothes, Skin, and Surface | Zenodo
[3] S. Mann and S. Haykin, “The chirplet transform: A generalization of Gabor’s logon transform,” Vision Interface ’91, pp. 205–212, June 3-7 1991, iSSN 0843-803X.
[4] “Steve mann,” Campus Canada, ISSN 0823-4531, p55 Feb-Mar 1985, pp58-59 Apr-May 1986, p72 Sep-Oct 1986.
[5] S. Mann, “Wavelets and chirplets: Time–frequency perspectives, with applications,” in Advances in Machine Vision, Strategies and Applications, world scientific series in computer science - vol. 32 ed., P. Archibald, Ed. Singapore . New Jersey . London . Hong Kong: World Scientific, 1992.
[6] P. Scourboutakos, M. H. Lu, S. Nerker, and S. Mann, “Phenomenologi- cally augmented reality with new wearable led sequential wave imprinting machines,” in Proceedings of the Tenth International Conference on Tangible, Embedded, and Embodied Interaction. ACM, 2017, pp. 751– 755.
[7] S. Mann, “Phenomenological Augmented Reality with SWIM,” pp. 220– 227, IEEE GEM2018.
[8] ——, “Surveillance, sousveillance, and metaveillance,” pp. 1408–1417, CVPR2016.
[9] S. Mann, P. V. Do, Z. Lu, and J. K. K. Lau, “Sequential wave imprinting machine (swim) implementation using sdr (software-defined radio),” in 2020 Seventh International Conference on Software Defined Systems (SDS). IEEE, 2020, pp. 123–130.


")